
Sami Salo
Marjut Koskela
Virve Sorvoja
Janne Kumpuoja
Kristian Ratia
Juha Kalliovaara
Tommi Tuomola
The use of Internet of Things (IoT) devices in the industry means that there are large amounts of data that must be transferred from the sensors to a data server. 5G technology provides fast connections, so that the data can be transferred quickly from one location to another and used in real-time applications. This paper shows a practical implementation of a real 5G industrial IoT use case in a joint demonstration between Centria University of Applied Sciences (Centria), Oulu University of Applied Sciences (OUAS) and Turku University of Applied Sciences (TUAS) based in a port environment.
Background
5G Vertical Integrated Industry for Massive Automation (5G VIIMA) project is researching new features of 5G technology, especially for industrial applications, with the aim of improving the competitiveness of Finnish industry and its capabilities in applying new wireless technology. In addition to 5G technology, the project will also develop and test new wireless industrial applications. By experimenting with new 5G network technology and new applications, experience is sought about the usability of a gradually evolving 5G network for various industrial applications both indoors and outdoors. Applications in the project include a closed factory building in Oulu managed by one owner, the industrial campus of several companies with indoor and outdoor facilities in Oulu and Tampere, and the energy network testing environment in Espoo. The project assesses the techno-economic impacts of regional networks, drawing on the experience of all experimental environments.
5G VIIMA provides Finnish industry and academic actors a concrete practical experience at what stage and how well the validated 5G technology is suitable for the factories’ wireless industrial network solution. Wireless industrial applications are still very rare, and this project produces and experiments new technologies for this need and combines the latest innovations in ecosystem collaboration with solutions specifically for demanding industrial conditions both indoors and outdoors. These new wireless industrial applications are expected to improve the competitiveness of factories and help the digitization of industrial campus services.
Joint demonstration
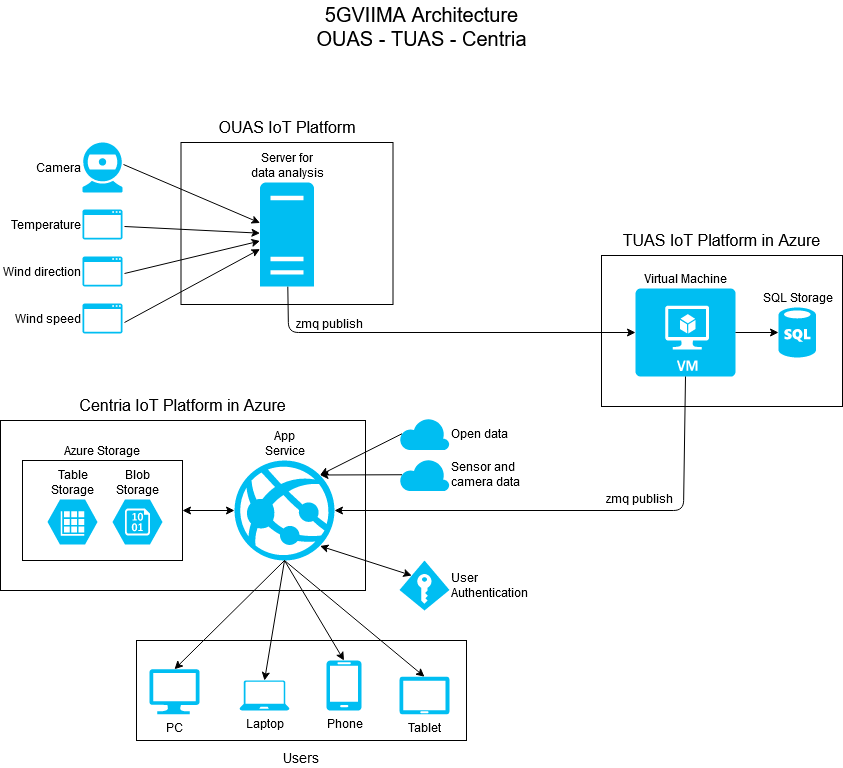
The goal in the joint demonstration between OUAS, TUAS and Centria was to analyze data from a weather station, store it for later use and display it on the map user interface (UI) to create situational awareness in an industrial environment. The OUAS’ weather station first sends the measured data to OUAS’ server to be analyzed. The analyzed data is then sent to TUAS’ cloud server for data storing. TUAS’ server forwards the data to Centria’s cloud server, which formats the data to be displayed on the map UI (Figure 1.).
OUAS – Producing data for transferring
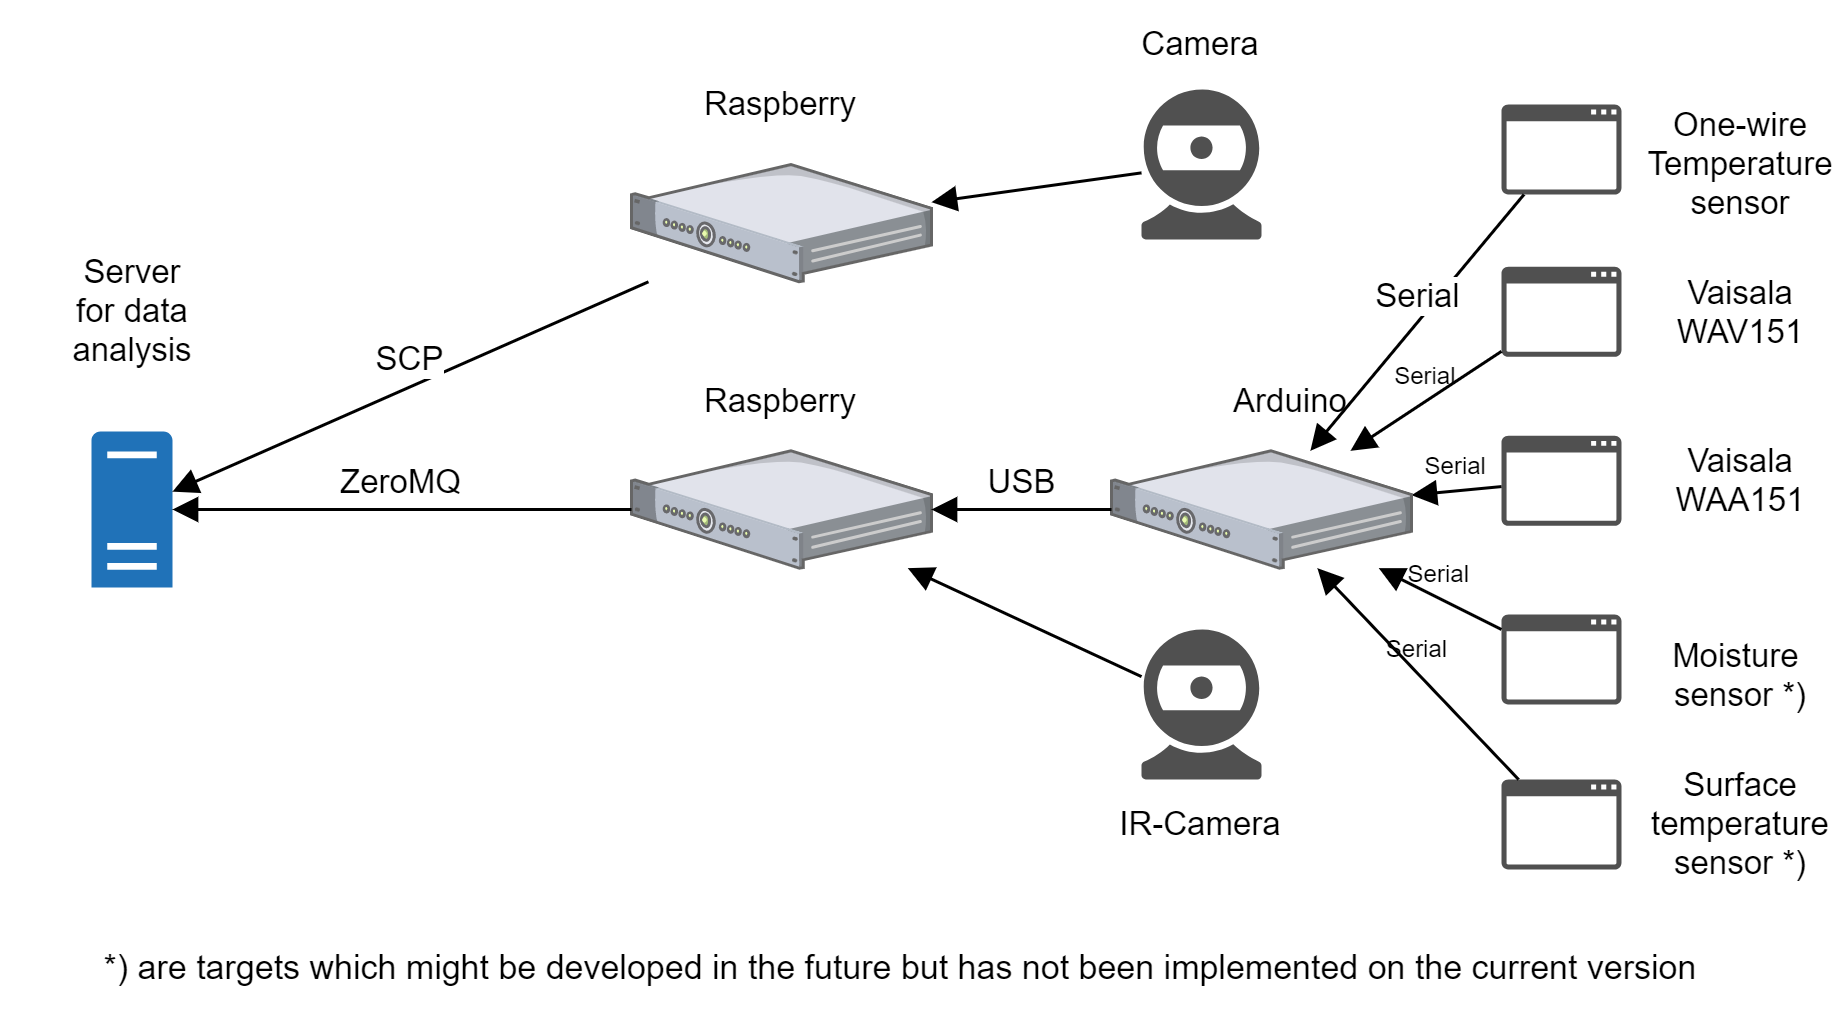
OUAS implemented a weather station that produces the data for the common 5G test environment. The weather station consists of a Vaisala WA15 wind sensor that is able to collect anemometrical and directional wind data, a one-wire digital temperature sensor, Arduino for reading the sensor data, and Raspberry Pi 4 which receives the processed wind speed and direction data from Arduino through USB interface and infrared wavelength camera connected to Raspberry’s camera interface for capturing images. Raspberry Pi is used to provide weather station’s connectivity to the outside world. The data produced by the weather station is sent to the server for image processing which is implemented by using open-source computer vision and machine learning software library OpenCV (OpenCV 2020). Theoretically, image processing with OpenCV could be implemented in the weather station’s Raspberry Pi, i.e. by using edge computing, but real-time image calculations were considered to be too mathematically complex to be implemented in the weather station itself thus the processing was decided to be done in separate Linux based server. The data collected to and processed by the image processing server is then sent to the cloud platform implemented by TUAS.
Commercial equipment to assess the friction of ground surfaces, like roads, does exist but they are rather expensive and one of the goals of building a self-made weather station was to investigate the possibilities of low-cost infrared cameras capabilities to be used as sensors. Study shows that there is a noticeable difference in spectral responses from different surfaces (Dry, wet, ice 1mm, ice 5mm, and snow 5mm) on infrared light which wavelengths were 900nm to 1700nm (Jonsson, Casselgren & Thörnberg 2015). With the information on the current spectral response, it is possible to know what kind of material surface is. Cameras that can capture images from 1000 nm to 1700 nm wavelengths are rather expensive and not as commonly available as are cameras that are able to capture less than 1000 nm wavelengths, so such a lower-end camera was decided to be used as an experimental device. In this case, the Pi NoIR Camera V2 connected to Raspberry Pi was selected to be used as such a sensor. Because camera does not have Infrared filter on the lens, it can produce images with roughly 400 nm – 900 nm wavelengths and when a visible light filter is used in it the wavelengths below 700 nm are cut off, so the server gets images that have wavelengths between 700 nm – 900nm.
Capturing images with the infrared wavelength in stabile conditions is rather easy, but in real-life conditions, the amount of natural light changes a lot at different times of the day and is depended on weather conditions and different seasons have an effect. A system that is calibrated to work in dark winter conditions with the source of infrared light coming mostly from weather station IR-leds does not work properly in summer conditions with lots of sunlight, because the amount of infrared light reflected from the sun differs a lot as does the amount of light reflected from the ground surface. In fact, at summertime the sun is so powerful source of infrared light, that sometimes it might be that system cannot recognize materials correctly or at all.
The server in this implementation uses OpenCV, Keras (Lee & Song 2019), and Convolutional Neural Networks for recognizing ground surface material (Rosebrock 2018). To produce wanted results, the server must learn any material one wants it to recognize and for these learning purposes, Keras needs a lot of captured images to be used as a reference for comparison. Example data for Keras to learn can be taken by arranging a scene that has all of the elements which Keras needs to recognize and take a lot of pictures from that scene. Running a set up a couple of days, there are a lot of images on different times of the day and different amounts of natural light on images. Cutting different materials from images to new images and moving them to different folders make it possible for Keras to learn the differences of different surfaces.
TUAS – Low latency data transfer pipeline
TUAS has previously developed a cloud platform in Microsoft Azure cloud for IoT-data storage, data analysis and visualization. For 5G VIIMA this platform was further developed to enable data transfer between OUAS, TUAS and Centria. The role of TUAS’ cloud platform in this joint demonstration is similar to classic message brokers with the added requirement that the data passing through is stored on the platform.
In order to enable low latency IoT-data pipeline between the parties producing the data and the consumers, a publish-subscribe model data storage was developed. ZeroMQ (ZeroMQ 2020) was chosen as a technology for the data packets based on its efficiency and the possibility to choose between a wide variety of different data transmission architecture patterns. In our joint demonstration use case, the data is transferred from OUAS’ weather station to Centria’s visualization application.
JSON (JSON 2020) was chosen as a data transfer format for its ease-of-use and wide applicability to different situations. JSON is a data interchange format that uses attribute-value pairs to store data in a human-readable form. TUAS, OUAS and Centria together agreed on a common structure for the data packets. Data in transmit is secured against corruption and altering by calculating integrity tokens at the transfer endpoints. The tokens are calculated by using pre-shared secret keys and the contents of the data packet to form a hash-based message authentication code.
The data packets transferred through the data pipeline are stored in a PostgreSQL (PostgreSQL 2020) database on TUAS’ platform. As the data packets in this joint demonstration are in well-defined standard format, Structured Query Language (SQL) was considered to be the natural choice for database language. PostgreSQL is an open source SQL language-based database system that is known for its reliability and scalability. This storage enables access to history data for authorized parties. PostgreSQL is extended with TimescaleDB (TimescaleDB 2020) for more efficient use of time-series data.
Centria – Data gathering and visualization platform
Centria has developed 5G data gathering and visualization platform to create the situational awareness of any industrial environment. The aim of the data gathering and visualization platform is to collect and store the data and to present it in the map user interface (UI). Situational awareness is important in industrial environments to increase safety and efficiency, therefore the platform is used in this demonstration to create it for the port environment by displaying vessels, trains, weather and sensor data on the map. Lack of situational awareness is recognized as one of the main causes of human errors, and increasing the awareness has a dramatic impact on human performance (D’Aniello, Loia & Orciuoli 2019).
The platform has been designed to be as flexible as possible, regardless of data type, connectivity or user equipment. In 5G Viima project, this platform has been developed for the port environment. This kind of a multi-stakeholder setting has a lot of different users and different needs for the platform. This creates the need for defining data ownership and restricting access to authorized users only. The platform supports the user authorization and displaying different data for different user groups.
Data is collected from different sources, for example open data like trains, vessels and weather. Open data means the freedom to use, reuse, and redistribute the data without restrictions, available in a usable and accessible form (Molloy 2011). Additional sensors, like weather stations and cameras, can be added to show the produced data on the map UI. Collected data is stored to the database from where it can be presented in the map UI for different users. Open data can be presented for all users, but sensitive data will be presented only for the data owner. The time interval for collecting the data and updating it to the users depend from the data source and how fast the values in the data change.
The collected data is sent to Azure storage on set time intervals, from where the Azure server can load and send the data to authenticated users when requested (Microsoft 2020). Stored data can be used for the history view in the map (Figure 3), where user can select any date and time from the past and see the data from that point in time. The history data is time series data, which can be used as an input to a neural network that can learn the patterns and give reliable predictions (Li, Liu, Liu & Liu 2019). In the future, the stored data could also be used for prediction of upcoming peak hours in the port area, for example when there are lots of vessels or when railway is used.
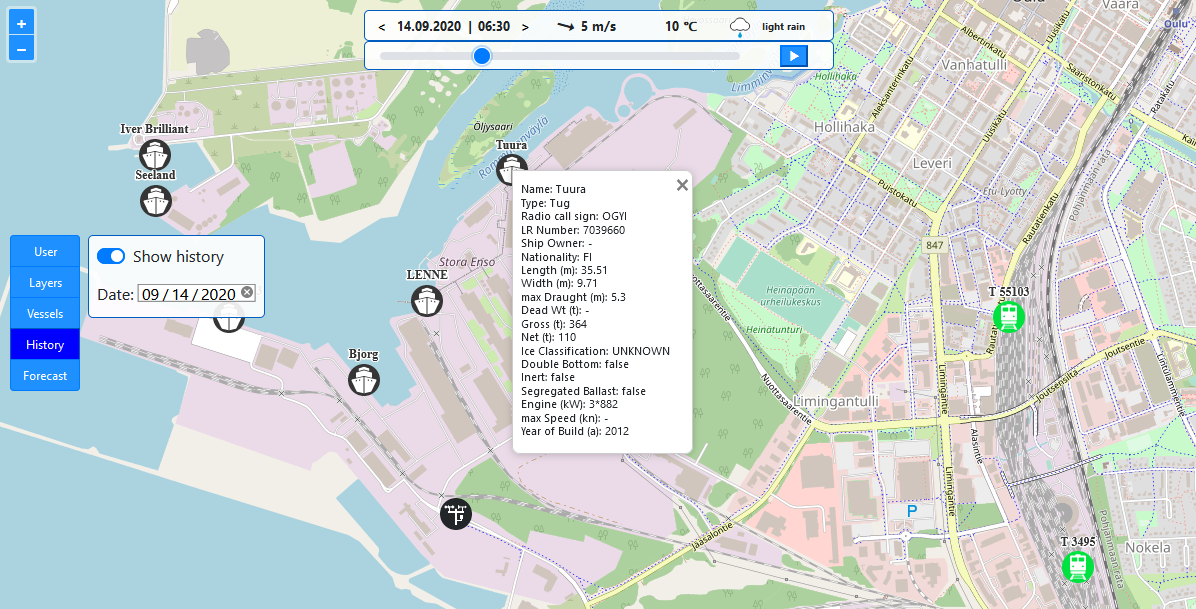
The visualization app can be viewed with modern web browsers. This means the app works on multiple different operating systems and devices. When a user logs in to the app, it displays a map from the port area. Location of vessels, trains and sensors are displayed as icons on the map UI. Each of these icons show information when clicked by the user, like temperature and wind speed from a weather station. By using a map UI to view the locations, users can quickly see the situation in the area, which improves safety in the port. It has been shown that humans have difficulties working with complex systems and that promoting operators’ situation awareness alleviates this problem and increases safety (Naderpour, Nazir & Lu 2015). Other useful information is easily accessed through the side menu buttons, like vessel timetables, history data and weather forecast.
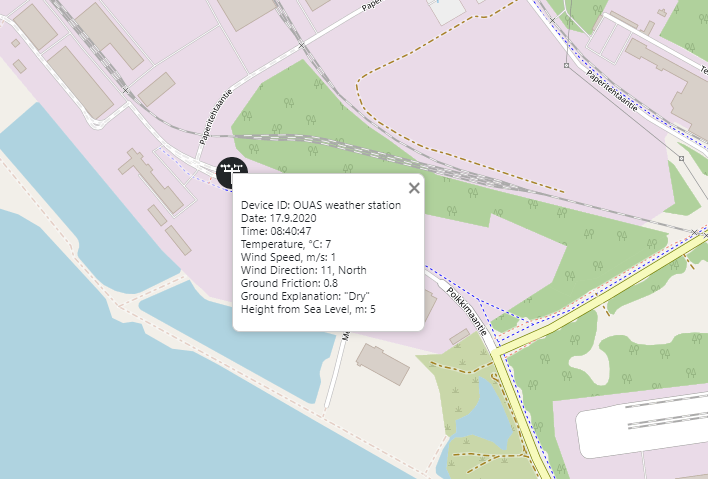
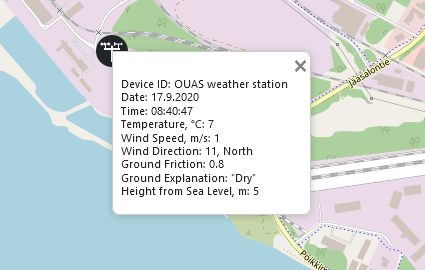
For the joint demonstration, Centria’s server in Azure receives the weather station data published by TUAS’ cloud server. The received data is formatted to be displayed on the map UI and presented to authenticated users. Information shown can be seen in Figure 4: device ID, date, time, temperature, wind speed, wind direction, ground friction, ground explanation and height from sea level. In this figure, the ground friction is 0.8 and the ground is dry, which means there is no ice on the ground and the road conditions are good.
Conclusion
The demonstration was successful and data from the OUAS’ weather station is shown on the Centria’s visualization platform. The ground surface material is determined from the images by the amount of infrared light it reflects. The friction of the ground is determined based on the material of the ground surface. This does not give the exact value of friction, instead it gives an amount of friction which the ground material usually has.
For now, the data flows only in one direction, from the OUAS’ weather station via TUAS’ server to the Centria platform. In the future, it could also go the other way and the history data could be used for example to predict weather and icing conditions. Analyzing all the weather data for locating points where the ground surface changes, it is possible to predict upcoming ground friction. For better prediction, there is a need for more sensors. Adding a moisture sensor and ground temperature sensor would help a lot for the prediction of the ground surface.
The current system only recognizes the ground surface and estimates the amount of friction from typical friction of the current surface. Better estimations could be made if the real friction would be measured on different types of weather and on different ground surfaces. After getting enough values of real friction, the system could estimate friction better based on current and past weather information. Without real measurements, friction is just a good estimation.
Acknowledgement
This work has been performed in the framework of 5G VIIMA Project. The authors would like to thank the 5G VIIMA consortium and Business Finland for the grant received for the project.
References:
D’Aniello, G., Loia, V., Orciuoli, F. 2019. An Adaptive System Based on Situation Awareness for Goal-Driven Management in Container Terminals. IEEE Intelligent Transportation Systems Magazine 11(4), 126 – 136. Available: https://ieeexplore.ieee.org/abstract/document/8844265
Jonsson, P., Casselgren, J., Thörnberg, B. 2015. Road Surface Status Classification Using Spectral Analysis of NIR Camera Images. IEEE Sensors Journal Vol. 15. No. 3, March 2015. Available: https://ieeexplore.ieee.org/document/6936308
JSON. Introducing JSON. Online document. Available: https://www.json.org/ Accessed: 29.9.2020.
Lee, H., Song, J. 2019. Introduction to convolutional neural network using Keras; an understanding from a statistician. Communications for Statistical Applications and Methods 2019, Vol. 26, No: 6, 591-610. Available: http://www.e-sciencecentral.org/upload/csam/pdf/csam-26-591.pdf
Li, Y., Liu, R., Liu, Z., Liu, J. 2019. Similarity Grouping-Guided Neural Network Modeling for Maritime Time Series Prediction. IEEE Access 7, 72647 – 72659. Available: https://ieeexplore.ieee.org/abstract/document/8727861
Microsoft. 2020. Azure documentation. Online document. Available: https://docs.microsoft.com/en-us/azure/?product=featured. Accessed: 15.9.2020.
Molloy, J. 2011. The Open Knowledge Foundation: Open Data Means Better Science. PLoS Biol 9(12): e1001195. Available: https://doi.org/10.1371/journal.pbio.1001195
Naderpour M., Nazir, S., Lu J. 2015. The role of situation awareness in accidents of large-scale technological systems. Process Safety and Environmental Protection 97, 13-24. Available: https://www.sciencedirect.com/science/article/pii/S0957582015001032
OpenCV. 2020. OpenCV documentation. Online document. Available: https://opencv.org/about/ Accessed: 22.9.2020.
PostgreSQL. 2020. PostgreSQL: The World’s Most Advanced Open Source Relational Database. Online document. Available: https://www.postgresql.org/ Accessed: 29.9.2020.
Rosebrock, A., Keras and Convolutional Neural Networks (CNNs). 2018. Online document. Available: https://www.pyimagesearch.com/2018/04/16/keras-and-convolutional-neural-networks-cnns/ Accessed 29.9.2020.
TimescaleDB. 2020. PostgreSQL for time‑series. Online document. Available: https://www.timescale.com/ Accessed 29.9.2020.
ZeroMQ. 2020. An open-source universal messaging library. Online document. Available: https://zeromq.org/ Accessed 29.9.2020.
Sami Salo
RD Developer
Centria University of Applied Sciences
Marjut Koskela
Project Manager
Centria University of Applied Sciences
tel. 040 729 9937
Virve Sorvoja
RD Specialist
Centria University of Applied Sciences
Janne Kumpuoja
Project Manager
Oulu University of Applied Sciences
Kristian Ratia
Project Planning Officer
Oulu University of Applied Sciences
Juha Kalliovaara
Senior Researcher
Turku University of Applied Sciences
Tommi Tuomola
Project Engineer
Turku University of Applied Sciences